Real Estate Terms: Median vs. Average

If you’re in the market for a new home, you’ve probably noticed monthly statistics related to your housing market being released in the news and online. These statistics are displayed in paragraphs, with trend lines, bar graphs, or comparative charts. Typically, the number of sold transactions is reported – how many houses have sold within the geographic area and time period. The closed median sale price is reported as well.
You may be asking, how does the median price help you understand the local housing market?
Here’s a refresher on a math lesson you may have learned in school – mean vs median.
Mean a.k.a. Average
The mean, aka average, is the sum total of all of the numbers divided by the quantity of items. The mean is used when all items in a set are directly comparable.
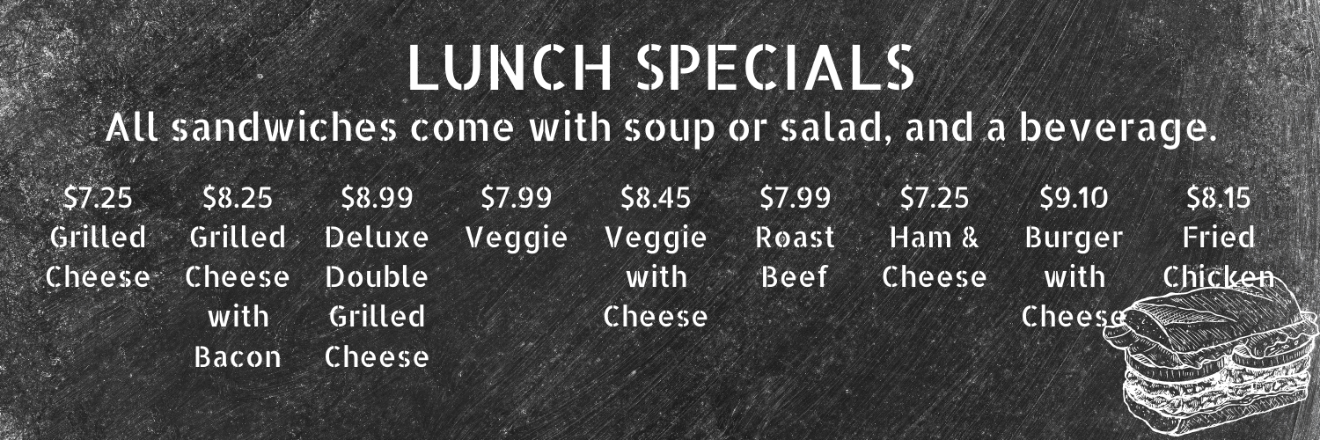
Take this lunch menu.

When you add all of the prices and divide by the quantity (9) on the board, you find the average price of a lunch special is $8.16.
A customer could expect to spend approximately $8.16 for lunch on a sandwich. Some lunches would be more expensive and some would be less, but they’re all approximately $8.16 for the same value – a sandwich, a soup or salad, and a beverage. Not a bad deal!
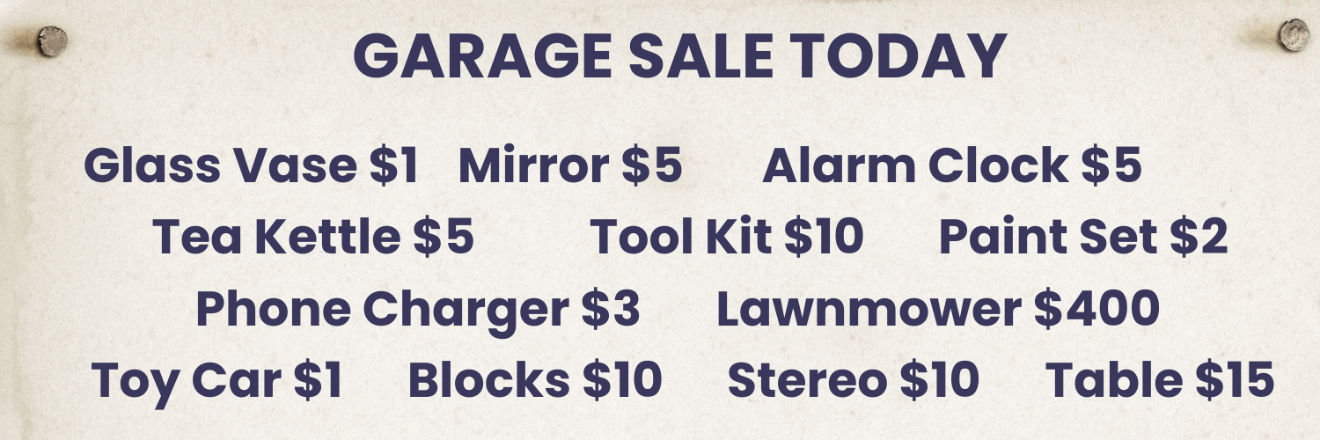
But now consider when items are not directly comparable. Consider this list of prices from a local garage sale.

The average price of an item at this garage sale is $38.92. (The total price $467 divided by 12 items is approximately $38.92.)
Look back at the list of items. Many of them fall below that average dollar amount. In fact, with only $15, one could buy nearly any of the items at the sale.
The lawnmower throws the average off. It’s an outlier with a much higher asking price than the rest of the items. It isn’t really comparable to most of the items in the sale either.
This is when the median is helpful.
Median
The median is the middle number of a set. When all items are lined up from least to greatest, the median is the central number to the set. This is especially useful when there are outliers and a wide range of prices.
The median of the set is $4 (between the two middle numbers $3 and $5). That is a much better representation of the price of garage sale goods.
Housing Market
Just like the lawnmower at the garage sale, the same is true for the housing market, but on a much larger scale. In every geographic region, there are homes that are outliers. There are plots of land and fixer uppers in need of a lot of TLC, which are sold for a very low price. There are much more expensive outliers that offer comparably more land, rooms, and features than most others in the area. These high-priced and low-priced homes may skew the average sale price of homes in the area.
The median sale price is a valuable statistic because that it better represents the selling price of the majority of homes in the geographic area.
If you have questions about Medians, Averages, or any of the complex statistics associated with the housing market, speak to a Realtor®. For the most up-to-date housing statistics, please visit www.onekeymls.com/market-statistics.


